
2021 Sortlist Report: Discover the Most In-Demand Digital Industries and the Top Locations for Creatives
Last update: 23 July 2024 at 11:28 am

 4.00/5
Creative work is in higher demand now than ever before, with the growth in online connectivity and the digital world.
Sortlist reveals the best cities and towns in the UK for digital creatives, the best countries for creative industries, and the most in-demand digital agencies of 2021.
The demand for web designers and mobile app developers is at an all-time high, and there are growing opportunities across the UK and abroad.
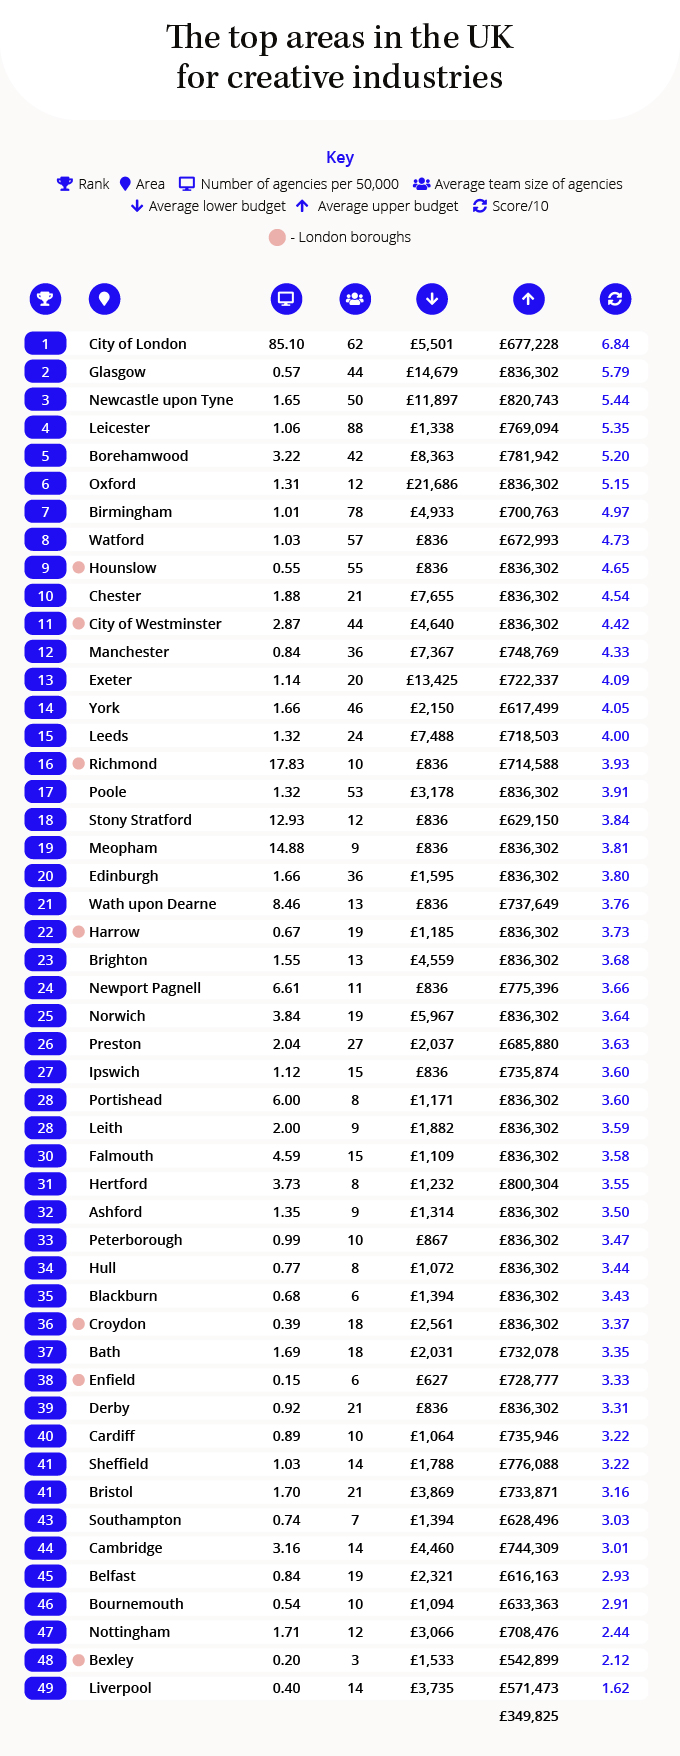
The Top Areas in the UK for Creative Industries
The best areas in the UK for creative industries are based on the number of digital agencies in each area, average team size, and average budget.

These are the best towns, cities and boroughs in the UK for creative industries. From advertising to graphic design, the locations below are the country’s top creative hubs.
- City of London – Score: 6.84/10
The UK is one of the world’s global leaders in creative industries, and there’s no better place for arts, culture and entertainment than London. It’s no surprise that the City of London, nestled inside England’s artistic capital, is the UK’s best place for creatives.
The City of London covers the capital’s primary business district in central London. With a population of around 9,000, the Square Mile is characterised by its skyscrapers and the thousands of people who work in them.
In the City of London, there are 85 active digital agencies registered on Sortlist for every 50,000 residents, the clear winner in this category!
The average upper budget listed by the City of London’s digital agencies on Sortlist is £677,228 – one of the highest in the UK.
The average team size of agencies in the City of London is 62, indicating that there may be increased job opportunities for creatives in the area.
Additionally, the average salary for a marketing job in the area is £40,585 per annum, or £3,82 per month, while the monthly cost of living minus rent is £862.20.
With a growing scene of startups and digital agencies, the City of London tops the list as the best place for creatives.
- Glasgow – Score: 5.79/10
The third-largest city in the UK is now named one of the best places for creatives. Home to one of the UK’s most well-established film and production industries, movies including The Flash and 1917 were shot in the Scottish city.
Glasgow scores well across many of the categories, although there is fewer than one agency for every 50,000 people in the city.
The average minimum budget listed by Glasgow agencies on Sortlist is over £14,679, which is the highest out of all areas except Oxford. The average upper budget is also one of the UK’s highest, at over £820,743.
The city also has an average team size of 44 people, making it one of the top 10 cities for larger teams.
The Scottish city offers an average annual marketing salary of £37,831 or £3,153 per month.
- Newcastle upon Tyne – Score: 5.44/10
The North East city of Newcastle upon Tyne rounds out the top three UK cities for creatives. With a score of 5.44 out of 10, the city is a creative hub for the north of England.
For every 50,000 people, Newcastle has 1.65 agencies, considerably more than Glasgow in the second spot.
While the average minimum budget in the city is £11,897, the average upper budget is a huge £769,094.
When it comes to team size, Newcastle upon Tyne is home to large teams with an average of 50 people in a team.
Newcastle ranks well for marketing salaries with the yearly average being £48,623, working out to £4,052 per month.
Spending hours |
From 32,000 agencies, we narrow down to only the ones you’ll love.
No commitment, totally free.
Stop searching. Start working.
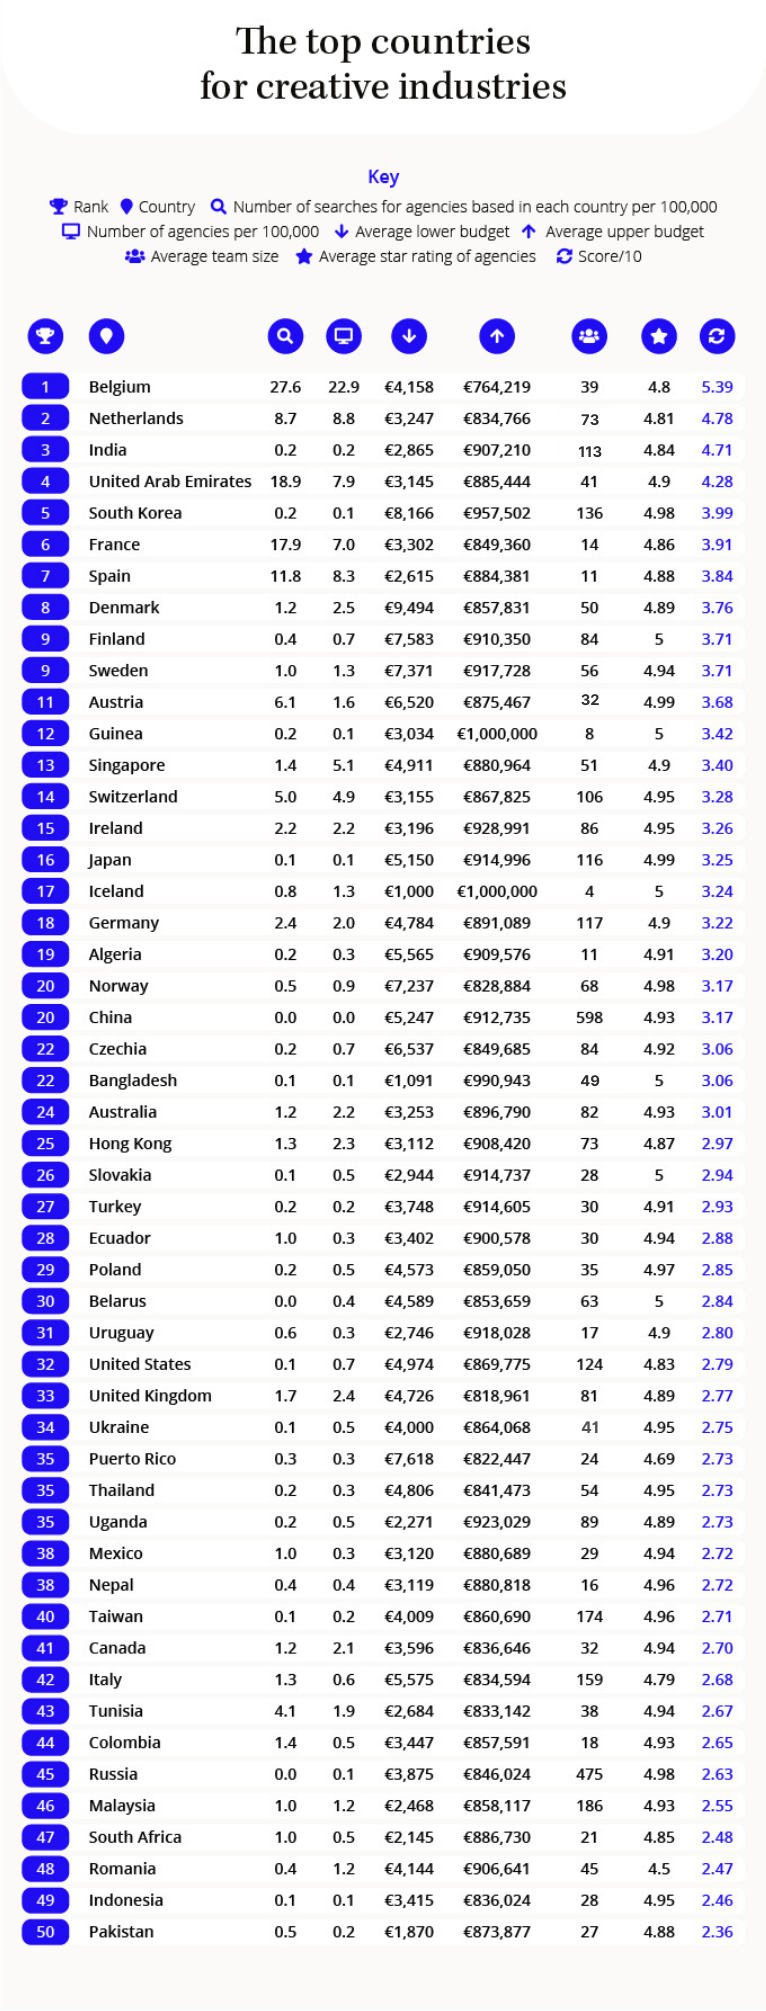
The Top Countries for Creative Industries
The best countries for digital creatives are ranked on the number of searches for agencies, number of agencies, average team size, average budget, and average star rating.
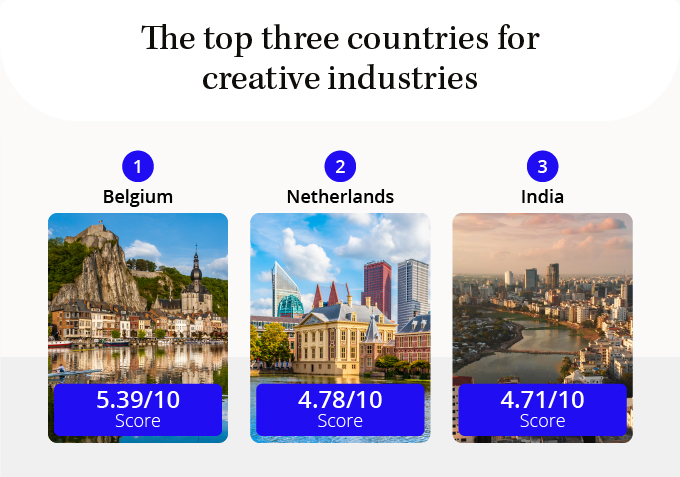
1. Belgium – 5.39/10
It’s no surprise to see Belgium in the top spot, as the best country for digital industries.
The cultural and creative industries in Belgium have seen significant growth in recent years, with an increase in creative shares and turnover in the sector. The rise in digital industries was seen particularly in Flanders, Belgium’s creative capital.
In 2021, there were over 27 searches on Sortlist, per 100,000 of the population, for digital agencies in Belgium. There’s clearly no denying the high demand for creative services in this European country.
For every 100,000 people, there are over 22 digital agencies in Belgium that are registered on Sortlist. The most common service listed is website creation.
However, the average team size for creative agencies on Sortlist in Belgium is 39, meaning there could be fierce job competition.
2. The Netherlands – Score: 4.78/10
Built on the legacy of some of the most famous artists of all time, including Rembrandt, Vermeer, and van Gogh, the Netherlands has one of the richest creative scenes in the world.
More recently, the Netherlands has become a market leader in TV and media through productions including The Voice and Netflix shows like Undercover.
In 2021, there were over eight searches for digital agencies in the Netherlands for every 100,000 of the population. The demand for creative services is met, with over 8 live agencies, per 100,000, based in the Netherlands.
The average team size of Dutch agencies is listed on Sortlist as over 73 people, indicating large projects and the possibility of positive career prospects for job-hunting creatives.
3. India – Score: 4.71
India is one of the best countries for creative industries – most known for their involvement in the media and entertainment industries, India saw a recent surge in the digital sector.
Industries including e-commerce and computer software development attract billions of dollars from investors, creating exponential growth.
There are over 0.2 Indian creative agencies on Sortlist for every 100,000 residents, but over 700 in total. The most common service advertised is website creation.
The average upper budget of agencies in India on Sortlist is over €900,000 and the average team size is over 100!
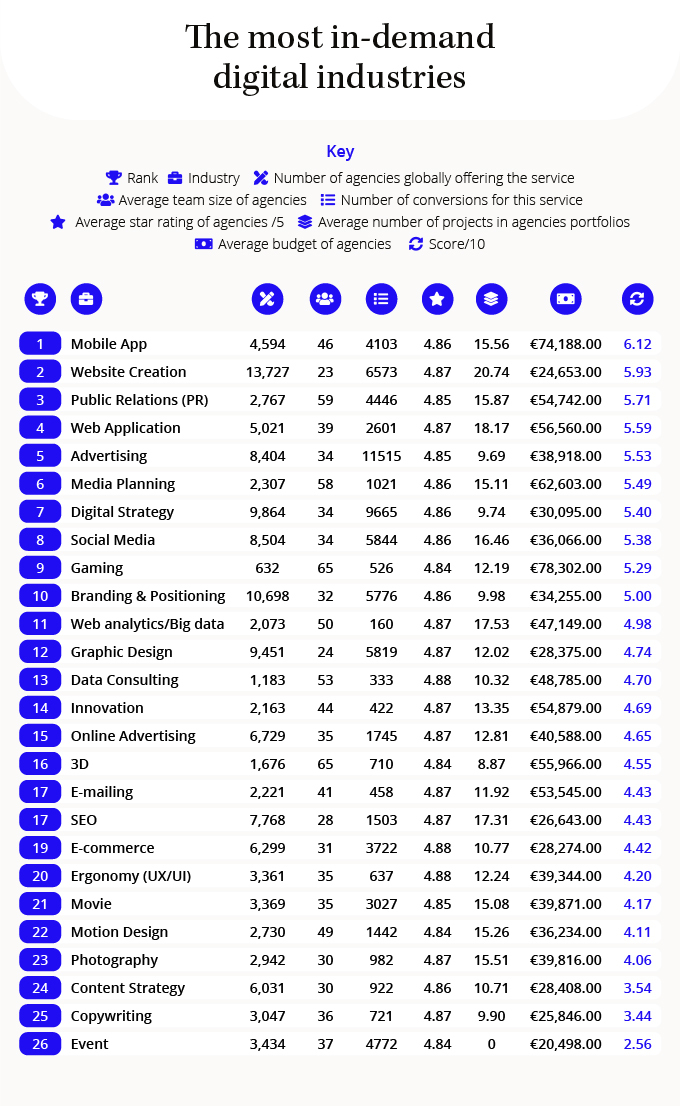
The Most In-Demand Digital Industries
The industries most in-demand in 2021 are based on the number of agencies offering the service, average team size, number of projects advertised, average star rating, average number of projects in each agency’s portfolio, and average budget.
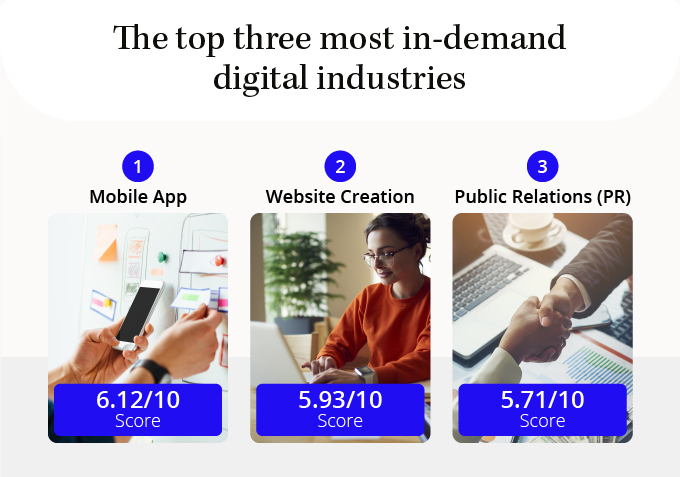
1. Mobile App – Score: 6.12/10
Mobile app development is one of the fastest-growing industries of recent years, as the number of smartphone users increases daily. More businesses, both big and small, are using mobile apps to reach and engage with customers.
Mobile apps are the perfect way to keep your target audience entertained, as mobile phones are an integral part of daily life for most.
There are over 4,500 agencies in the world on Sortlist that offer mobile app development as a service.
Although there are fewer agencies than for branding and social media, the average team size in the mobile app industry is 46 people – one of the largest out of all sectors!
The average budget for agencies in mobile app development shows there’s money in the industry – at over €74,000, the only agencies with a higher average budget are in gaming!
2. Website Creation – Score: 5.93/10
Website creation encompasses everything from graphic design and user interface to coding. With such a wide variety of roles and the rising need for businesses to have a high-quality website, it’s easy to see why web creation is in high demand.
On Sortlist, there are over 13,000 active agencies in the world that offer services in website creation, the clear winner in this category. Globally, web creation is the most popular digital industry – it was the most common service offered by almost half of all countries!
The average team size listed by web creation agencies on Sortlist is the smallest out of all industries at just 23. The average budget of agencies in web creation is over €24,000.
3. Public Relations (PR) – Score: 5.71/10
Today, the world is connected online so a strong digital presence is essential to any company. Public relations is one of the most effective ways to build your business and grow your brand, so it’s no wonder that it’s one of 2021’s most in-demand industries.
There are over 2,000 agencies across the world on Sortlist offering PR services and the average team size is 59.
The average budget of PR agencies on Sortlist is over €54,000 – one of the highest out of all industries.
The Most In-Demand Digital Industries by Country
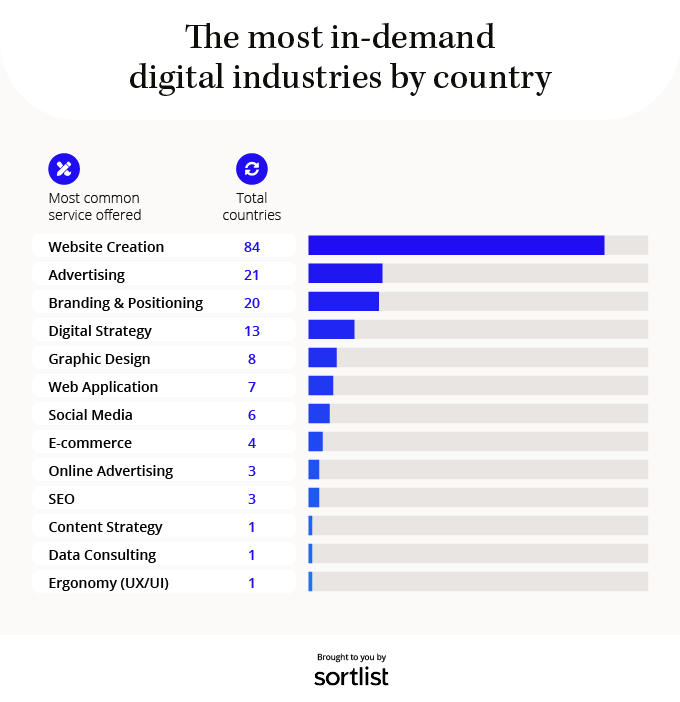
The most popular service advertised on Sortlist is website creation. Almost 50% of all countries listed website creation as their most common digital service.
Advertising is the most common creative service offered in over 12% of countries.
The Top Areas in the UK for Creative Industry Salaries
When it comes to salary, there are particular areas of the UK which seem to offer far more within the marketing industry than others. We looked at average salaries in marketing according to Glassdoor submissions, comparing these monthly salaries to the average monthly cost of living (minus rent or mortgage costs) to find which cities had the highest proportion of salary remaining after cost of living is factored in.
- Blackburn – cost of living accounts for 11.17% of average salary
With an average annual salary of £60,115, marketing experts in the Lancashire town of Blackburn get the most bang for their buck. The average cost of living for a single person, without factoring in rent or mortgage costs is just £559.79 per month, leaving marketers in the area with 88.83% of their monthly income.
- Preston – cost of living accounts for 11.30% of average salary
In second place is another Lancashire location, the city of Preston. The average annual salary in this city is £65,358 while the monthly cost of living is just £615.28. This leaves Preston marketing specialists with 88.70% of their salaries before they pay their monthly housing costs.
- Liverpool – cost of living accounts for 14.27% of average salary
Proving that the north west reigns supreme, the city of Liverpool rounds out the top three cities with an average annual salary of £55,666. Cost of living stands at an average of £662.12, leaving 85.73% of the monthly salary.
The top countries for creative industry salaries
When we look at salaries at a country level, we can see which locations offer the most when compared to the cost of living. Salaries are taken as averages so may vary largely across the country.
- United States – cost of living accounts for 15.05% of average salary
Sitting at the top of the list is the United States with an average monthly salary of €5,495 and an average cost of living of €827. This leaves 84.95% of salary before housing costs are accounted for.
- Finland – cost of living accounts for 18.31% of average salary
In joint second place, Finland has an average marketing salary of €3,676 per month with a cost of living average of €673, leaving 81.69% of salary after cost of living is accounted for.
- Denmark – cost of living accounts for 18.31% of average salary
Denmark rounds out second place with an average monthly salary of €5,078 and an average of €930 for cost of living.
Methodology
To find the best locations for creatives we used data obtained from Sortlist on the following factors: number of live agencies in the area, number of searches for agencies based in the area, average budget of agencies, average team size, and average star rating. Areas with incomplete data were removed before they were ranked, and the top 50 were revealed.
To find the most in-demand industries, Sortlist data was collected for the following factors: number of agencies in the world offering the service, average team size, number of projects advertised, average star rating of agencies offering the service, average number of projects in agencies portfolios, and average budget. This formed the final ranking.
The score was achieved by giving each factor a normalised score out of 10. An average of each of these scores was then taken to give an overall score out 10 for each city, country and industry.
Salary data is taken from averages submitted to Glassdoor. This was then compared against the average monthly cost of living for a single person in each area without rent or mortgage costs included, taken from Numbeo.
The populations for each location were taken from the most recent figures listed on Wikipedia.
Lorem ipsum dolor sit amet, consectetur adipiscing elit. Duis non magna nec sem finibus placerat non quis erat. Aliquam vitae semper diam. Fusce quis eros ac augue pharetra tristique ut vitae ante.
Hugo da Costa